Data Analytics With Visualization

  • Home
  • Data Analytics With Visualization

Data Analyst Training Course Key Highlights

Real-Time Experts
Placement Support
Live Project
Certified Professional
Affordable Fees
Flexibility To assist
No Cost EMI
Free Soft Skills

Data Analytics With Visualization

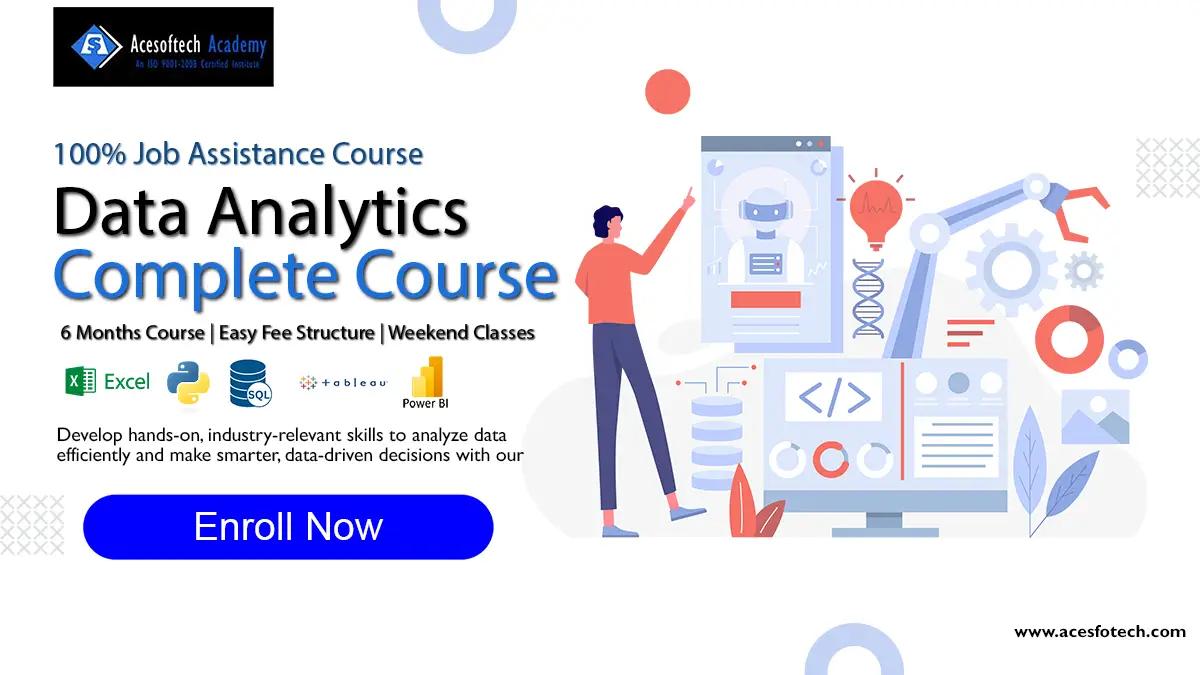
Data Analytics with Visualization, also known as Data Science with Visualization, is an innovative approach to analyzing and interpreting data by utilizing visual representations. It combines the power of data analytics techniques with visually appealing graphics in order to gain valuable insights from vast amounts of information.

girl
Overview

Acesoftech Academy, a renowned institution in Kolkata, offers a comprehensive Data Analytics course that includes specialized training in Data Visualization. Students enrolled in this program are equipped with the necessary skills to manipulate and analyze complex datasets using cutting-edge tools and technologies. By employing various visualization techniques such as charts, graphs, and interactive dashboards, analysts can effectively communicate their findings to both technical and non-technical audiences. With 100% placement assistance provided by Acesoftech Academy, aspiring data scientists have the opportunity to secure promising career opportunities upon completing this exceptional course.

Why Choose Acesoftech Academy for Data Analytics Training in Kolkata?
  • Industry-Driven Curriculum: The program is designed to cover essential data science concepts and advanced visualization tools like Tableau and Power BI.
  • Expert Guidance: Learn from experienced trainers who bring real-world industry expertise to the classroom.
  • Practical Learning: Work on hands-on projects and case studies to gain job-ready skills and practical experience.
  • Career Support: Receive placement assistance, including resume building and interview preparation, to kickstart your career.
  • Affordable and Flexible: Enjoy high-quality training at an affordable cost, with flexible schedules to suit working professionals and students.
Career Benefits of Pursuing a Data Analytics Training Course in Kolkata @ Acesoftech Academy
  • High Demand for Skills: The growing reliance on data across industries has created a significant demand for skilled data analysts, offering job security and competitive salaries.
  • Diverse Career Paths: Data analytics opens doors to various roles, including data analyst, business analyst, data scientist, and more, with opportunities in multiple industries.
  • Versatility Across Sectors: Skills in data analytics are valuable in fields like healthcare, finance, retail, technology, education, and more, allowing professionals to explore various domains.
  • Opportunities for Growth: As the field evolves, data analytics professionals can upskill in advanced techniques like machine learning, AI, and big data, leading to career advancement.
  • Global Career Potential: The universal applicability of data analytics makes it a highly sought-after skill worldwide, enabling professionals to work across different geographies.
  • Problem-Solving Expertise: A career in data analytics develops strong analytical and problem-solving skills, which are critical for tackling complex business challenges.
  • Innovation and Leadership Roles: As organizations increasingly rely on data-driven strategies, data analysts often find themselves in key decision-making and leadership positions.
  • Competitive Edge in the Job Market: Having expertise in data analytics sets candidates apart, making them highly desirable in competitive job markets.
  • Freelance and Consulting Opportunities: Data analytics professionals can explore freelancing and consulting options, offering flexibility and the chance to work on diverse projects.
  • Future-Ready Career: With advancements in technology and growing reliance on data, a career in data analytics ensures relevance in an increasingly digital and data-driven world.
Data Analytics Course Syllabus
    • Counting, Probability, and Probability Distributions
    • Sampling Distributions
    • Estimation and Hypothesis Testing
    • Scatter Diagram
    • Anova and Chi-Square
    • Imputation Techniques
    • Data Cleaning
    • Correlation and Regression
    • Data Analytics Overview
    • Importance of Data Analytics
    • Types of Data Analytics
    • Descriptive Analytics
    • Diagnostic Analytics
    • Predictive Analytics
    • Prescriptive Analytics
    • Benefits of Data Analytics
    • Data Visualization for Decision Making
    • Data Types, Measure of Central Tendency, Measures of Dispersion
    • Graphical Techniques, Skewness & Kurtosis, Box Plot
    • Descriptive Stats
    • Sampling Funnel, Sampling Variation, Central Limit Theorem, Confidence Interval
    • Microsoft Excel Fundamentals
    • Entering and Editing Texts and Formulae
    • Working with Basic Excel Functions
    • Inserting Images and Shapes into an Excel Worksheet
    • Creating Basic Charts in Excel
    • Importing and Exporting Data
    • Excel Pivot Tables
    • Conditional Function
    • Lookup Functions
    • Data Analysis Tool
    • Python Introduction
    • Python Comments
    • Python Variables
    • Python Operators
    • Python Data Types
    • Python Conditions
    • Python Loops
    • Python Functions
    • Python OOPS Concepts
    • Python Modules
    • Python Datetime
    • Python JSON
    • Python Exception Handling
    • Python User Input
    • Python String Formatting
    • Python File Handling
    • Introduction to Oracle Database
    • Retrieve Data using the SQL SELECT Statement
    • Learn to Restrict and Sort Data
    • Usage of Single-Row Functions to Customize Output
    • Invoke Conversion Functions and Conditional Expressions
    • Aggregate Data Using the Group Functions
    • Display Data from Multiple Tables Using Joins
    • Use Subqueries to Solve Queries
    • The SET Operators
    • Data Manipulation Statements
    • Use of DDL Statements to Create and Manage Tables
    • Other Schema Objects
    • Control User Access
    • Management of Schema Objects
    • Manage Objects with Data Dictionary Views
    • Manipulate Large Data Sets
    • Data Management in Different Time Zones
    • Retrieve Data Using Sub-queries
    • Regular Expression Support
    • What is Data Visualization
    • Working with Dimensions
    • Data Management Filters
    • Filters in Detail
    • Advance Visuals and Features in Tableau
    • Get Started with Power BI
    • Overview: Power BI Concepts
    • Sign up for Power BI
    • Overview: Power BI Data Sources
    • Connect to a SaaS Solution
    • Upload a Local CSV File
    • Connect to Excel Data that Can Be Refreshed
    • Connect to a Sample
    • Create a Report with Visualizations
    • Explore the Power BI Portal
    • Overview: Visualizations
    • Using Visualizations
    • Create a New Report
    • Create and Arrange Visualizations
    • Format a Visualization
    • Create Chart Visualizations
    • Use Text, Map, and Gauge Visualizations and Save a Report
    • Use a Slicer to Filter Visualizations
    • Sort, Copy, and Paste Visualizations
    • Download and Use a Custom Visual from the Gallery
    • Modify and Print a Report
    • Rename and Delete Report Pages
    • Add a Filter to a Page or Report
    • Set Visualization Interactions
    • Print a Report Page
    • Send a Report to PowerPoint
    • Create a Dashboard
    • Create and Manage Dashboards
    • Pin a Report Tile to a Dashboard
    • Pin a Live Report Page to a Dashboard
    • Pin a Tile from Another Dashboard
    • Pin an Excel Element to a Dashboard
    • Manage Pinned Elements in Excel
    • Add a Tile to a Dashboard
    • Build a Dashboard with Quick Insights
    • Set a Featured (Default) Dashboard
    • Ask Questions about Your Data
    • Ask a Question with Power BI Q&A
    • Tweak Your Dataset for Q&A
    • Enable Cortana for Power BI
    • Share Data with Colleagues and Others
    • Publish a Report to the Web
    • Manage Published Reports
    • Share a Dashboard
    • Create an App Workspace and Add Users
    • Use an App Workspace
    • Publish an App
    • Create a QR Code to Share a Tile
    • Embed a Report in SharePoint Online
    • Use Power BI Mobile Apps
    • Get Power BI for Mobile
    • View Reports and Dashboards in the iPad App
    • Use Workspaces in the Mobile App
    • Sharing from Power BI Mobile
    • Use Power BI Desktop
    • Install and Launch Power BI Desktop
    • Get Data
    • Reduce Data
    • Transform Data
    • Relate Tables
    • Get Power BI Desktop Data with the Power BI Service
    • Export a Report from Power BI Service to Desktop
    • New DAX Functions
    • Date and Time Functions
    • Time Intelligence Functions
    • Filter Functions
    • Information Functions
    • Logical Functions
    • Math & Trig Functions
    • Parent and Child Functions
    • Text Functions
What You Will Achieve by the End of the Data Analytics Course?

Data Analyst is an open-source eCommerce platform that empowers developers and businesses to create highly customized online stores. Its key features include:

  • Understand Data Fundamentals: Gain a deep understanding of data structures, data types, and the lifecycle of data analysis.
  • Analyze Large Datasets: Learn to clean, process, and analyze large datasets using tools like Python, R, or Excel.
  • Visualize Data Effectively: Create insightful and impactful data visualizations using tools like Tableau, Power BI, or Matplotlib.
  • Write SQL Queries: Retrieve, manipulate, and manage data from databases using SQL with confidence.
  • Solve Real-World Problems: Work on real-world projects to identify business challenges and use data-driven approaches to solve them.
  • Interpret Statistical Models: Apply statistical techniques to uncover patterns and trends for better decision-making.
our testimonial

happy students feedback

Acesoftech Academy is a fantastic destination for mastering data science. They provide both flexible online and classroom-based sessions, valuable career guidance, and practical learning tools. The instructors are highly skilled and supportive, creating an ideal environment for honing your skills. I truly appreciate Acesoftech Academy!

Imran

I'm Alex, and my experience with the .NET course at Acesoftech Academy was exceptional. The instructors offered clear and effective guidance, and the hands-on sessions allowed me to grasp essential concepts thoroughly. I now feel confident and ready to take the next step in my .NET development career.

Alex

I recently completed the online Magento Development course at Acesoftech Academy from the USA, and it exceeded my expectations. The curriculum was thorough, covering everything from setup to advanced topics. My instructor, Umar, was highly skilled, supportive, and ensured all my queries were answered clearly.

Paul Smith

I am Harshitha LN from Bangalore. Acesoftech Academy was a great find. I opted for remote one-on-one training, which was highly beneficial. Umar Sir, with his vast knowledge and industry experience, trained me from basics to real-time projects, tailoring the pace to my learning needs.

Harshitha LN

ASKED QUESTIONS

Magento 2.x Course FAQs

Anyone interested in working with data and making informed decisions can learn data analytics. This includes professionals in IT, business, marketing, or even individuals with non-technical backgrounds who want to enhance their analytical skills.

The average salary for a data analyst varies by experience, location, and industry. Typically, it ranges from $60,000 to $100,000 annually, with experienced professionals earning even higher.

Basic knowledge of Excel, statistics, and some programming (e.g., Python, SQL) is helpful. However, beginners can start with foundational courses designed to teach these skills.

Yes, weekend classes are available for working professionals and students with busy weekday schedules.

Yes, flexible payment options are offered to ensure students can manage their finances while learning data analytics.

Data analytics is not hard to learn if you have the right resources and guidance. Our structured curriculum simplifies complex topics and ensures a smooth learning experience.

The duration depends on the course structure. A comprehensive data analytics course typically takes 2 to 4 months for part-time learners and shorter for full-time learners.

Yes, our online data analytics courses provide live sessions, recorded lectures, and hands-on projects, offering the flexibility to learn from anywhere.

The course typically includes Excel basics, data visualization tools (like Tableau or Power BI), SQL for database management, Python or R programming, statistics, and real-world project applications.

Yes, upon successful completion, you will receive a certificate that validates your expertise in data analytics, enhancing your resume and job prospects.

icon
Career Assistance
  • Build an Impressive Resume
  • Get Tips from Trainer to Clear Interviews
  • Attend Mock-Up Interviews with Experts
  • Get Interviews & Get Hired
Get In Touch